Quick Summary (TL;DR) — China Shipping Rates, September 2025
-
Ocean: declines to USA/Canada & Europe; sharp rise to Mexico; mixed elsewhere.
-
Air: mostly stable with spot increases (UK, Germany, Argentina/Colombia/Ecuador).
-
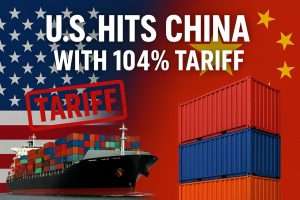
Backdrop: active reciprocal tariffs, Red Sea rerouting, and fleet oversupply → downward pressure on ocean rates.
China → North America (USA, Canada, Mexico) — September 2025
Key trends
-
USA: ocean down on both coasts; air stable.
-
Canada: ocean slightly down; air unchanged.
-
Mexico: strong ocean increases; air stable.
Rate table — China → North America
| Country / Port | Type | Ocean (USD) | Δ % | Air (USD/kg) | Δ % |
|---|---|---|---|---|---|
| USA – Los Angeles/Long Beach | 20GP | 1880 → 1600 | -15% | 4.5 (LAX) → 4.5 | 0% |
| 40HQ | 2350 → 2300 | -2% | – | – | |
| USA – New York / Savannah / Norfolk | 20GP | 2650 → 2100 | -21% | 5.6 (JFK) → 5.6; 5.5 (MIA) → 5.5 | 0%; 0% |
| 40HQ | 3150 → 2750 | -13% | – | – | |
| Canada – Toronto | 20GP | 4000 → 3500 | -13% | 5.8 (YYZ) → 5.8 | 0% |
| 40HQ | 4400 → 4300 | -2% | – | – | |
| Canada – Montreal | 20GP | 3550 → 3550 | 0% | 5.8 (YUL) → 5.8 | 0% |
| 40HQ | 4300 → 4300 | 0% | – | – | |
| Canada – Vancouver | – | – | – | 5.5 (YVR) → 5.5 | 0% |
| Mexico – Manzanillo | 20GP | 2500 → 3750 | +50% | 7 (MEX) → 7 | 0% |
| 40HQ | 3000 → 4600 | +53% | – | – | |
| Mexico – Lázaro Cárdenas | 20GP | 2500 → 3750 | +50% | 7 (GDL / MTY) → 7 / 7 | 0% / 0% |
| 40HQ | 3000 → 4600 | +53% | – | – |
Usual ranges: USA West 1600–2300; USA East 2100–2750; Canada 3500–4300; Mexico 3750–4600.
Air (typical): USA 4.5–5.6; Canada 5.5–5.8; Mexico 7 USD/kg.
What’s driving it (fast read)
-
USA/Canada: post–frontloading cool-down, better vessel reliability → downward pressure on FAK.
-
Mexico: demand + capacity tightness (Pacific gateways) → price spike on 20GP/40HQ.
-
Air: belly & integrator capacity largely sufficient → flat pricing at LAX/JFK/MIA/YYZ/YUL/YVR/MEX.
Boxing economics: 40HQ vs 2×20GP (illustrative savings)
| Lane (Ocean) | 20GP (USD) | 2×20GP (USD) | 40HQ (USD) | $ Saved with 40HQ |
|---|---|---|---|---|
| China → LA/LB | 1600 | 3200 | 2300 | 900 |
| China → NY/SAV/ORF | 2100 | 4200 | 2750 | 1450 |
| China → Toronto | 3500 | 7000 | 4300 | 2700 |
| China → Manzanillo/Lázaro | 3750 | 7500 | 4600 | 2900 |
Rule of thumb: pick 40HQ when
40HQ rate + local fees < (2 × 20GP) + extra THC/handling. On current quotes, 40HQ wins on all shown NA lanes.
Air freight: when does it make sense?
-
Volumetric factor: 167 kg/m³ (IATA).
-
Indicative cost per m³:
-
LAX @ 4.5 USD/kg → ~755 USD/m³
-
JFK @ 5.6 USD/kg → ~935 USD/m³
-
MEX @ 7.0 USD/kg → ~1169 USD/m³
-
-
Use air for: launches, high-margin SKUs, spare parts, freight-sensitive ecommerce.
-
Sea–air option: China → ICN/SIN/HKG by sea, then air to JFK/YYZ/MEX if you need 7–12 days faster without full air spend.
Transit time & booking guidance (planning buffers)
| Destination | Typical FCL TT* | Booking lead time | Notes |
|---|---|---|---|
| USA West (LA/LB) | 12–18 days on-water | 1–2 weeks | Best reliability; easy IPI to inland US. |
| USA East (NY/SAV/ORF) | 28–40 days (via Panama/Suez) | 2–3 weeks | Longer TT; watch EC port windows. |
| Canada West (Vancouver) | 13–20 days | 1–2 weeks | Gateway to Prairie provinces via rail. |
| Canada East (Toronto/Montreal) | 28–38 days | 2–3 weeks | Rail dwell can vary—build slack. |
| Mexico (Manzanillo/Lázaro) | 15–25 days | 3–4 weeks | Capacity tight—book early. |
| *Port-to-port on water, excl. CY cutoffs, customs, dray/rail. |
Port & routing playbook (by country)
United States
-
West Coast (LA/LB): exploit the rate dip; consider FAK short terms + spot for flexibility.
-
East Coast (NY/SAV/ORF): if TT is too long, price LA/LB + rail to Midwest/East vs all-water EC—often competitive and faster.
-
Air (LAX/JFK/MIA): keep allocations for peak weeks; use deferred products for non-urgent cargo.
Canada
-
Toronto/Montreal: lock lower FAK; build rail buffer (yard congestion fluctuates).
-
Vancouver: smoothest Pacific entry; plan IPI to Calgary/Edmonton/Winnipeg.
-
Air (YYZ/YUL/YVR): stable—great for SKU launches.
Mexico
-
Manzanillo/Lázaro: lanes are hot—book 3–4 weeks ahead; confirm equipment (40HQ) early.
-
Compare Manzanillo vs Lázaro on drayage to your DC; price inland rail to CDMX/GDL/MTY.
-
Air (MEX/GDL/MTY): steady; good for urgent replenishment only.
Landed-cost checklist (NA)
-
Incoterms alignment (EXW/FOB/CIF/DDP) with clear who-pays-what.
-
Duty + ocean/air modeled together; run a what-if with alternate gateways (e.g., LA/LB + rail vs all-water EC).
-
Surcharges to watch: PSS/GRI, BAF, ECA, Panama toll pass-through, chassis & pier pass.
-
Equipment strategy: prioritize 40HQ (savings above) unless cube/weight constraints force split into 20s.
-
Compliance: ensure HS codes, docs (CI/PL/BL), and ISF (USA) / ACI (Canada) timelines are met.
Quick wins (action items)
-
Quote both: LA/LB + rail to your ZIP vs all-water to EC; pick faster/cheaper mix.
-
Switch to 40HQ where possible—saves $900–$2900 per box vs 2×20GP (examples above).
-
Reserve Mexico space now (3–4 wks).
-
Use air selectively and calculate $/m³ with 167 kg/m³ to avoid margin erosion.
China → Europe & Mediterranean — September 2025
Key trends
-
UK/NL/FR/DE/BE (main ports): ocean -26% to -28%; air up at select hubs (LHR, HAM).
-
Mediterranean (Italy/Turkey): ocean stable; Spain slight ocean drop, air modestly higher.
-
Switzerland/Poland: steep ocean declines; air stable.
Mediterranean — Rates (China → Med)
| Country / Port | Type | Ocean (USD) | Δ % | Air (USD/kg) | Δ % |
|---|---|---|---|---|---|
| Italy – Genoa | 20GP | 2650 → 2650 | 0% | 3.5 → 3.5 | 0% |
| 40GP | 3300 → 3300 | 0% | – | – | |
| Spain – Barcelona / Valencia | 20GP | 2115 → 2100 | -0.7% | 4.17 → 4.3 | +3.1% |
| 40GP | 3100 → 2800 | -9.7% | – | – | |
| Turkey – Istanbul | 20GP | 1460 → 1460 | 0% | 4.5 → 4.5 | 0% |
| 40GP | 2550 → 2550 | 0% | – | – |
Europe — Main ports (UK/NL/FR/DE/BE)
| Country / Port | Type | Ocean (USD) | Δ % | Air (USD/kg) | Δ % |
|---|---|---|---|---|---|
| UK/NL/FR/DE/BE (ocean hubs) | 20GP | 1900 → 1400 | -26.3% | – | – |
| 40GP/HQ | 3250 → 2350 | -27.7% | – | – | |
| UK – LHR | – | – | – | 3.0 → 4.2 | +40% |
| UK – MAN | – | – | – | 4.2 → 4.2 | 0% |
| UK – BHX | – | – | – | 4.0 → 4.2 | +5% |
| Germany – HAM | – | – | – | 3.5 → 4.0 | +14.3% |
Europe — Other ports (CH/PL)
| Country / Port | Type | Ocean (USD) | Δ % | Air (USD/kg) | Δ % |
|---|---|---|---|---|---|
| Switzerland – Basel | 20GP | 2550 → 1600 | -37.3% | 4.0 → 4.0 | 0% |
| 40GP | 4400 → 2500 | -43.2% | – | – | |
| Poland – Gdansk | 20GP | 2300 → 2100 | -8.7% | 4.0 → 4.0 | 0% |
| 40GP | 3700 → 2800 | -24.3% | – | – |
Usual ranges: 20GP 1400–2650; 40’ 2350–3300; air 4.0–4.5 USD/kg (with UK/DE spikes).
What’s driving the moves (fast read)
-
Fleet oversupply + lingering Red Sea rerouting keep ocean FAK under pressure across North Europe.
-
Air tightens selectively in UK/DE (e-commerce / just-in-time), hence LHR/HAM uplifts.
-
Med relatively balanced: Italy/Turkey flat, Spain trims on 40GP.
Boxing economics: 40HQ vs 2×20GP (illustrative)
| Lane (Ocean) | 20GP (USD) | 2×20GP (USD) | 40GP/40HQ (USD) | $ Saved with 40 vs 2×20 |
|---|---|---|---|---|
| UK/NL/FR/DE/BE hubs | 1400 | 2800 | 2350 | 450 |
| Italy – Genoa | 2650 | 5300 | 3300 | 2000 |
| Spain – BCN/VLC | 2100 | 4200 | 2800 | 1400 |
| Turkey – Istanbul | 1460 | 2920 | 2550 | 370 |
| Switzerland – Basel | 1600 | 3200 | 2500 | 700 |
| Poland – Gdansk | 2100 | 4200 | 2800 | 1400 |
Takeaway: On most EU lanes, 40HQ/40GP beats 2×20GP materially—especially Italy/Spain/Poland.
Air freight economics (volumetric 167 kg/m³)
| Hub | Posted rate (USD/kg) | ≈ Cost per m³ (USD) |
|---|---|---|
| UK – LHR | 4.2 | ≈ 701 |
| Germany – HAM | 4.0 | ≈ 668 |
| Spain (avg.) | 4.3 | ≈ 718 |
| Italy (avg.) | 3.5 | ≈ 585 |
| Turkey (avg.) | 4.5 | ≈ 752 |
| Switzerland (avg.) | 4.0 | ≈ 668 |
| Poland (avg.) | 4.0 | ≈ 668 |
Use air for: launch-critical SKUs, MRO/spares, high-margin goods. Consider sea→air pivots (e.g., via HKG/ICN/SIN) if you need 7–12 days faster without full-air spend.
Transit time & booking guidance (planning buffers)
| Destination cluster | Typical FCL TT* | Booking lead time | Notes |
|---|---|---|---|
| North Europe (UK/NL/DE/BE/FR) | 28–42 days | 1–2 weeks | Rerouting can stretch TT; barge/rail into hinterland helps. |
| Western Med (ES/IT FR-Med) | 22–32 days | 1–2 weeks | Stable capacity; Spain currently attractive on 40GP. |
| Eastern Med (TR) | 18–28 days | 1–2 weeks | Competitive export corridors; check transshipment windows. |
| CH/PL (inland/feeder) | 30–45 days | 2–3 weeks | Add 2–5 days for feeder/rail legs and customs. |
| *Port-to-port on water; exclude CY cutoffs, customs, feeder/rail and last-mile. |
Routing playbook (by sub-region)
North Europe (UK/NL/DE/BE/FR)
-
Exploit ocean softness with short-term FAK + spot.
-
Compare all-water to UK vs continental base ports (RTM/HAM/ANT) + feeder to UK for cost/schedule resilience.
-
For inland FR/DE/BE/NL, price barge/rail vs trucking from the base port.
Mediterranean (Italy/Spain/Turkey)
-
Italy/Turkey flat → predictable planning; Spain offers 40GP value this month.
-
Choose direct Med calls when speed matters; use transshipment only if price delta is significant.
CH/PL (Basel/Gdansk)
-
Large ocean drops—leverage to extend validity or secure banded rates.
-
Account for feeder/rail variability; build 2–5 days slack.
Landed-cost checklist (EU/UK)
-
Incoterms clarity (FOB/CIF/DDP) & who owns ENS/ICS2 filings.
-
Model duties + freight; test alternative gateways (e.g., RTM/HAM vs direct UK).
-
Watch surcharges: BAF/CAF, war/contingency, EU environmental/ETS pass-throughs.
-
Equipment: shift to 40HQ/40GP where cube allows (savings above).
-
Docs & timelines: commercial invoice, packing list, ENS cut-offs, certificates (where applicable).
Quick wins (actionable)
-
Lock North Europe FAK now; ask for short-term indexed clauses.
-
Spain 40GP is a sweet spot—quote it vs IT/TR when your DC is Iberia/S. France.
-
Pick 40HQ over 2×20GP on IT/ES/PL to save $1.4k–$2.0k per box (illustrative above).
-
Keep air allocations at LHR/HAM for promo weeks; use deferred for non-urgent flows.
China → Africa — September 2025
Key trends
-
West/Central/South: ocean down; East mixed; North stable.
-
Air: generally stable but elevated on corridors with cold-chain and e-commerce demand.
Rate table — China → Africa
| Region / Country | Port | Type | Ocean (USD) | Δ % | Air (USD/kg) | Δ % |
|---|---|---|---|---|---|---|
| West Africa | Ghana (Tema) | 20GP | 3600 → 3200 | -11% | 7.1 → 7.7 | +8% |
| Nigeria (Apapa) | 20GP | 4550 → 4100 | -10% | 6.1 → 6.1 | 0% | |
| Côte d’Ivoire (Abidjan) | 20GP | 3600 → 3200 | -11% | 8 → 8 | 0% | |
| East Africa | Kenya (Mombasa) | 20GP | 1600 → 1600 | 0% | 5.7 → 5.5 | -4% |
| Rwanda (Kigali) | 20GP | 7400 → 7500 | +1% | 7 → 7 | 0% | |
| Uganda (Kampala) | 20GP | 5810 → 5460 | -6% | 6.5 → 6.5 | 0% | |
| Central Africa | Congo (Matadi) | 20GP | 5300 → 4600 | -13% | 7 → 7 | 0% |
| South Africa | Durban | 20GP | 3275 → 3075 | -6% | 5.5 → 5.5 | 0% |
| Cape Town | 20GP | 3375 → 3175 | -6% | – | – | |
| North Africa | Sudan | 20GP | 6100 → 6100 | 0% | 6.5 → 6.5 | 0% |
Note: China export Regulation 150 (lamps, low-voltage electrics, “functional” garments) + tighter inspections in West Africa (e.g., Nigeria) ⇒ build lead-time buffers and keep documentation airtight.
What’s driving the moves (fast read)
-
Ample vessel capacity + softer demand in several West/Central/Southern lanes → ocean rate declines.
-
East Africa mixed: Kenya flat, inland corridors (UG/KG) influenced by feeder/landside costs.
-
Air stays pricey but steady where e-commerce and cold chain (e.g., salmon to JNB/ACC/LOS) keep belly space tight.
Boxing economics: 40HQ vs 2×20GP (illustrative, based on this month’s quotes)
When 40’ rates are available, 40HQ/40GP usually beats two 20’ on total cost.
| Lane (Ocean) | 20GP (USD) | 2×20GP (USD) | 40GP/40HQ (USD) | $ Saved with 40 vs 2×20 |
|---|---|---|---|---|
| Ghana – Tema | 3200 | 6400 | 3600 | 2800 |
| Nigeria – Apapa | 4100 | 8200 | 4600 | 3600 |
| Côte d’Ivoire – Abidjan | 3200 | 6400 | 3600 | 2800 |
| Congo – Matadi | 4600 | 9200 | 5700 | 3500 |
| Uganda – Kampala | 5460 | 10920 | 6570 | 4350 |
| South Africa – Durban | 3075 | 6150 | 4150 | 2000 |
| Rwanda – Kigali | 7500 | 15000 | 8600 | 6400 |
| Sudan | 6100 | 12200 | 6270 | 5930 |
Takeaway: On most Africa lanes, 40’ is the smarter buy (savings from $2k to $6.4k/box in these examples), provided cube/weight allow.
Air freight economics (volumetric 167 kg/m³)
| Hub | Posted rate (USD/kg) | ≈ Cost per m³ (USD) |
|---|---|---|
| Accra (ACC) | 7.7 | ≈ 1,285.9 |
| Lagos (LOS) | 6.1 | ≈ 1,018.7 |
| Abidjan (ABJ) | 8.0 | ≈ 1,336.0 |
| Nairobi (NBO) | 5.5 | ≈ 918.5 |
| Kigali (KGL) | 7.0 | ≈ 1,169.0 |
| Kampala (EBB) | 6.5 | ≈ 1,085.5 |
| Johannesburg (JNB) | 5.5 | ≈ 918.5 |
| Khartoum (KRT) | 6.5 | ≈ 1,085.5 |
Use air for launch-critical SKUs, spares/MRO, and high-margin products. Consider sea→air pivots (e.g., via HKG/ICN/SIN) if you need 7–12 days faster without paying full-air end-to-end.
Transit time & booking guidance (planning buffers)
| Sub-region | Typical FCL TT* | Booking lead time | Notes |
|---|---|---|---|
| West Africa (GH/NG/CI) | 30–45 days | 2–3 weeks | Transshipment & port windows add variability; pre-clear where possible. |
| East Africa (KE/UG/RW) | 20–30 days | 2–3 weeks | Inland legs to UG/RW can add 2–7+ days; plan rail/road handoffs. |
| Central Africa (CG) | 28–40 days | 2–3 weeks | Feeder schedules sensitive—build slack. |
| South Africa (ZA) | 22–32 days | 1–2 weeks | Capacity fairly stable; JNB air is a solid back-stop. |
| North Africa (SD) | 20–28 days | 1–2 weeks | Check routeing (via Suez/Med) and security surcharges. |
| *Port-to-port on water; exclude CY cutoffs, customs, feeder/rail and last-mile. |
Routing playbook (by sub-region)
West Africa (Ghana, Nigeria, Côte d’Ivoire)
-
Pre-clearance & CTN/BESC (where applicable) minimize dwell.
-
Book earlier; confirm equipment (40HQ) and transshipment legs.
-
Keep air fallback for urgent SKUs (ACC/LOS/ABJ).
East Africa (Kenya, Uganda, Rwanda)
-
Use Mombasa as ocean gateway; manage inland rail/road to EBB/KGL.
-
Kenya air softened slightly—good for small urgent replenishments.
Central Africa (Congo)
-
Expect feeder variability; prioritize carriers with stronger schedule reliability.
-
40’ economics typically beat 2×20’ (see table).
South Africa
-
Durban/Cape Town ocean rates eased—lock short-term FAK.
-
JNB air is stable; allocate for cold-chain/e-com spikes.
North Africa (Sudan)
-
Stable but watch security/contingency surcharges and documentary requirements.
Landed-cost & compliance checklist (Africa)
-
Incoterms clarity (FOB/CIF/DDP) and who handles advance cargo info / security filings.
-
Model duty + freight together; compare gateways (e.g., direct vs transshipment) on total landed cost.
-
Confirm CTN/BESC/BSC and any PSI/standards programs where applicable.
-
Surcharges to watch: PSS/GRI, BAF/CAF, contingency/war, chassis/terminal fees.
-
Docs & timing: Commercial invoice, packing list, BL, certificates; keep buffers for inspections.
Quick wins (actionable)
-
Switch to 40’ where possible—saves $2k–$6k vs 2×20’ on many Africa lanes.
-
Pre-book West Africa (2–3 wks) to secure equipment and transshipment windows.
-
Use air selectively (calculate $/m³ with 167 kg/m³ to protect margins).
-
For UG/RW inland, pad timelines and align handoffs (port → rail/road).
China → Asia–Pacific (APAC) — September 2025
Key trends
-
Oceania: ocean up (AU +11–14%, NZ +41–44%); AU air -5%.
-
ASEAN: ocean stable to up (SG/MY/TH/VN/PH), targeted declines in Indonesia; air mixed.
-
South Asia: India up (ocean), Sri Lanka modest ocean rise; air stable.
-
East Asia: Japan stable (ocean/air).
Rate table — China → APAC
| Sub-region / Country | Port | Type | Ocean (USD) | Δ % | Air (USD/kg) | Δ % |
|---|---|---|---|---|---|---|
| Oceania – Australia (SYD/MEL/BNE) | 20GP | 1350 → 1500 | +11.1% | 4 → 3.8 | -5% | |
| 40GP | 2550 → 2900 | +13.7% | – | – | ||
| Oceania – New Zealand (AKL) | 20GP | 850 → 1200 | +41.2% | 4 → 4 | 0% | |
| 40GP | 1600 → 2300 | +43.8% | – | – | ||
| ASEAN – Singapore | 20GP | 325 → 325 | 0% | 2 → 1.5 | -25% | |
| ASEAN – Malaysia (PKG/PNG/PGU) | 20GP | +7.1–11.1% | 1.5 → 2 | +33.3% | ||
| ASEAN – Indonesia (JKT/SUB/SMG) | 20GP | -9.6–+19% | 2.3 → 2.3 | 0% | ||
| ASEAN – Thailand (BKK/LCB) | 20GP | +16.4–30.9% | 1.5 → 1.5 | 0% | ||
| ASEAN – Vietnam (HCM/HPH) | 20GP | 0–+11.1% | 1.5 → 1.5 | 0% | ||
| ASEAN – Philippines (MNL/CEB) | 20GP | 0–+33.3% | 2.1 → 1.5 | -28.6% | ||
| South Asia – India (Nhava Sheva/Chennai) | 20GP | +17.4–22.2% | 4.5 → 4.5 | 0% | ||
| South Asia – Sri Lanka (Colombo) | 40GP | 1700 → 1950 | +14.7% | 5.5 → 5.5 | 0% | |
| East Asia – Japan (TYO/YOK/KOB) | 40GP | 500 → 450 | -10% | 1.5 → 1.5 | 0% |
What’s driving it (fast read)
-
Oceania: resilient demand + lingering network imbalances → higher FAK, especially NZ.
-
ASEAN: supply plentiful; Indonesia pockets of weakness; SG/MY/TH/VN/PH holding or ticking up.
-
South Asia: India uplift on export strength and equipment dynamics; Sri Lanka moderate uptrend.
-
Japan: stable contract/spot environment → predictability month-on-month.
Boxing economics: 40’ vs 2×20’ (illustrative)
Where both sizes are available, a single 40’ often beats two 20’ on total ocean cost.
| Lane (Ocean) | 20GP (USD) | 2×20GP (USD) | 40GP/40HQ (USD) | $ Saved with 40 vs 2×20 |
|---|---|---|---|---|
| Australia (SYD/MEL/BNE) | 1500 | 3000 | 2900 | 100 |
| New Zealand (AKL) | 1200 | 2400 | 2300 | 100 |
| India (midpoint example) | ~1500 | 3000 | ~1650 | ~1350 |
| Sri Lanka (CMB) | 1600 | 3200 | 1950 | 1250 |
| Japan (TYO/YOK/KOB) | 300 | 600 | 450 | 150 |
Notes: India midpoints are inferred from the given ranges (20GP 1350–1650, 40GP 1450–1850) for illustration.
Air freight economics (volumetric 167 kg/m³)
| Hub | Posted rate (USD/kg) | ≈ Cost per m³ (USD) |
|---|---|---|
| Australia (typ.) | 3.8 | ≈ 634.6 |
| New Zealand (AKL) | 4.0 | ≈ 668.0 |
| Singapore (SIN) | 1.5 | ≈ 250.5 |
| Malaysia (KUL/PGU) | 2.0 | ≈ 334.0 |
| Indonesia (CGK/SUB) | 2.3 | ≈ 384.1 |
| Thailand (BKK) | 1.5 | ≈ 250.5 |
| Vietnam (SGN/HAN) | 1.5 | ≈ 250.5 |
| Philippines (MNL/CEB) | 1.5 | ≈ 250.5 |
| India (BOM/MAA) | 4.5 | ≈ 751.5 |
| Sri Lanka (CMB) | 5.5 | ≈ 918.5 |
| Japan (TYO/OSA) | 1.5 | ≈ 250.5 |
Use air for launches, high-margin SKUs, and service-critical replenishment. Consider sea→air (e.g., via HKG/ICN/SIN) when you need 7–12 days faster without paying full end-to-end air.
Transit time & booking guidance (planning buffers)
| Sub-region | Typical FCL TT* | Booking lead time | Notes |
|---|---|---|---|
| Oceania (AU/NZ) | 12–26 days | 1–2 weeks | NZ runs longer; check direct vs T/S routings. |
| ASEAN (SG/MY/TH/VN/PH/ID) | 5–14 days | 1–2 weeks | Short-haul feeders can swing by a few days—build slack. |
| South Asia (IN/LK) | 10–22 days | 2–3 weeks | India gateway choice (NS/Chennai) changes TT and rail options. |
| East Asia (JP) | 3–10 days | 1–2 weeks | High frequency; aim for direct loops where possible. |
| *On-water port-to-port; exclude CY cutoffs, customs, feeder/rail and last-mile. |
Routing playbook (by sub-region)
Oceania (Australia/New Zealand)
-
Quote direct vs transshipment—pay a little more for direct when lead time matters.
-
Equipment: secure 40GP/40HQ early; NZ can be tighter than AU.
ASEAN (Singapore/Malaysia/Thailand/Vietnam/Philippines/Indonesia)
-
Singapore is a reliable sea→air pivot with lower air $/m³.
-
Malaysia/Philippines seeing air increases/decreases respectively—pick hubs accordingly.
-
For Indonesia, leverage ports (JKT/SUB/SMG) based on factory cluster to avoid inland drag.
South Asia (India/Sri Lanka)
-
India: compare Nhava Sheva vs Chennai; inland rail can offset all-water to some destinations.
-
Sri Lanka: steady hub; 40GP economics attractive vs 2×20GP.
East Asia (Japan)
-
Predictable loops; use 40GP where cube allows (beats 2×20 on cost).
Landed-cost & compliance checklist (APAC)
-
Incoterms clarity (FOB/CIF/DDP) and who handles manifest/security filings.
-
Model duties + freight together; test alternate gateways (e.g., SIN vs direct) on total landed cost.
-
Watch surcharges: BAF/CAF, war/contingency where applicable, peak/GRI notices.
-
Equipment strategy: prefer 40’ when feasible; validate weight/cube and local handling.
-
Keep documents tight (CI/PL/BL) and align cut-offs (CY/VGM) to avoid rollovers.
Quick wins (actionable)
-
Lock AU/NZ allocations early; quote direct sailings for priority SKUs.
-
Use Singapore as a sea→air lever for urgent drops (low $/m³).
-
On India/Sri Lanka, switch to 40’—saves $1.25k–$1.35k vs 2×20’ (illustrative).
-
For ASEAN, route via hubs with favorable air ($/m³) when timelines compress.
China → Latin America — September 2025
Key trends
-
Ocean: down in Argentina/Brazil/Uruguay; up in Chile/Colombia/Ecuador/Cuba.
-
Air: generally stable; up in AR/CO/EC, down in UY
Rate table — China → Latin America
| Country / Port | Type | Ocean (USD) | Δ % | Air (USD/kg) | Δ % |
|---|---|---|---|---|---|
| Argentina – Buenos Aires | 20GP | 4880 → 3500 | -28% | 7.0 → 7.3 | +4% |
| 40HQ | 5150 → 3600 | -30% | – | – | |
| Argentina – Rosario | 20GP | 6600 → 4800 | -27% | – | – |
| 40HQ | 7000 → 5300 | -24% | – | – | |
| Brazil – Santos | 40HQ | 5150 → 3700 | -28% | 6.0 → 6.0 | 0% |
| Brazil – Rio de Janeiro | 40HQ | 4700 → 3700 | -21% | – | – |
| Brazil – Paranaguá | 40HQ | 5150 → 3700 | -28% | – | – |
| Chile – Valparaíso | 20GP | 2900 → 3750 | +29% | 7.0 → 7.0 | 0% |
| 40HQ | 3600 → 4600 | +28% | – | – | |
| Chile – San Antonio | 20GP | 2800 → 3750 | +34% | – | – |
| 40HQ | 3400 → 4600 | +35% | – | – | |
| Colombia – Buenaventura | 20GP | 2800 → 3750 | +34% | 7.1 → 8.0 | +13% |
| 40HQ | 2950 → 4600 | +56% | – | – | |
| Cuba – Mariel | 20GP | 7450 → 8000 | +7% | 10 → 10 | 0% |
| 40HQ | 8950 → 8500 | -5% | – | – | |
| Ecuador – Guayaquil | 20GP | 2700 → 3750 | +39% | 10 → 11 | +10% |
| 40HQ | 3000 → 4600 | +53% | – | – | |
| Uruguay – Montevideo | 20GP | 4880 → 3500 | -28% | 8.8 → 8.0 | -9% |
| 40HQ | 5150 → 3600 | -29% | – | – |
Usual ranges:
-
Ocean: AR/BR/UY trending down; CL/CO/EC/CU elevated at 3750–4600+ (40HQ up to 4600–8500 on CU).
-
Air (typical): AR 7.3, BR 6.0, CL 7.0, CO 8.0, EC 11.0, UY 8.0, CU 10.0 USD/kg.
What’s driving it (fast read)
-
Divergent demand & capacity: oversupply and softer import demand weigh on Argentina/Brazil/Uruguay; Chile/Colombia/Ecuador/Cuba face tighter space/stronger demand, lifting ocean rates.
-
Air remains steady region-wide with localized upticks (AR/CO/EC) and a drop in UY, reflecting shifting belly capacity and product mix.
Boxing economics: 40HQ vs 2×20GP (illustrative)
Where both sizes are available, a single 40HQ typically beats two 20GPs on total ocean cost.
| Lane (Ocean) | 20GP (USD) | 2×20GP (USD) | 40HQ (USD) | $ Saved with 40HQ |
|---|---|---|---|---|
| Argentina – Buenos Aires | 3500 | 7000 | 3600 | 3400 |
| Argentina – Rosario | 4800 | 9600 | 5300 | 4300 |
| Chile – Valparaíso | 3750 | 7500 | 4600 | 2900 |
| Chile – San Antonio | 3750 | 7500 | 4600 | 2900 |
| Colombia – Buenaventura | 3750 | 7500 | 4600 | 2900 |
| Cuba – Mariel | 8000 | 16000 | 8500 | 7500 |
| Ecuador – Guayaquil | 3750 | 7500 | 4600 | 2900 |
| Uruguay – Montevideo | 3500 | 7000 | 3600 | 3400 |
Takeaway: On most LATAM lanes, 40HQ offers $2.9k–$7.5k savings vs 2×20GP (subject to equipment and local fees).
Air freight economics (volumetric 167 kg/m³)
| Hub | Posted rate (USD/kg) | ≈ Cost per m³ (USD) |
|---|---|---|
| Buenos Aires (EZE) | 7.3 | ≈ 1,219 |
| São Paulo/Rio (GRU/GIG) | 6.0 | ≈ 1,002 |
| Santiago (SCL) | 7.0 | ≈ 1,169 |
| Bogotá (BOG) | 8.0 | ≈ 1,336 |
| Guayaquil (GYE) | 11.0 | ≈ 1,837 |
| Montevideo (MVD) | 8.0 | ≈ 1,336 |
| Havana (HAV) | 10.0 | ≈ 1,670 |
Use air for launch-critical SKUs and high-margin goods; consider sea→air via Mexico/US gateways or Panama/Caribbean hubs if you need faster delivery without full end-to-end air spend.
Transit time & booking guidance (planning buffers)
| Sub-region / Gateways | Typical FCL TT* | Booking lead time | Notes |
|---|---|---|---|
| Pacific Coast (CL/PE/EC/CO) | 25–40 days | 2–3 weeks | Direct Pacific loops vs Panama transshipment change TT & reliability. |
| East Coast South America (BR/AR/UY) | 35–50 days | 2–3 weeks | Longer hauls; watch Cape/Suez routeing and port windows. |
| Caribbean (CU) | 32–45 days | 3–4 weeks | Documentation sensitive; validate gateway and feeder schedules. |
| *Port-to-port on water; exclude CY cutoffs, customs, feeder/rail, and last-mile. |
Routing playbook (by sub-region)
Pacific Coast (Chile/Colombia/Ecuador)
-
Quote direct vs transshipment (Panama/MEX) and pick the mix that balances TT & cost.
-
Chile currently higher on ocean—secure space early and compare San Antonio vs Valparaíso for inland economics.
East Coast South America (Brazil/Argentina/Uruguay)
-
With ocean down, lock short-term FAK; price alternative base ports (e.g., Santos vs Paranaguá, BA vs MVD) for dray/rail trade-offs.
-
For Argentina/Uruguay, consider Montevideo as a comparative gateway for certain flows.
Caribbean (Cuba)
-
Plan for longer TT and strict docs; confirm equipment (40HQ) early and align transshipment windows.
Landed-cost & compliance checklist (LATAM)
-
Align Incoterms (FOB/CIF/DDP) and responsibilities for pre-arrival filings.
-
Model duty + freight together; compare gateways (e.g., Santos vs Paranaguá; San Antonio vs Valparaíso).
-
Track surcharges: BAF/CAF, Panama toll pass-throughs, contingency/war, peak/GRI, chassis/terminal.
-
Validate equipment (favor 40HQ where cube allows) and local THC/handling.
-
Keep documentation tight (CI/PL/BL; any licenses/permits as applicable) to avoid dwell.
Quick wins (actionable)
-
Switch to 40HQ where feasible—saves $2.9k–$7.5k vs 2×20GP this month.
-
Pre-book rising lanes (Chile/Colombia/Ecuador/Cuba) to secure space and equipment.
-
On Argentina/Brazil/Uruguay, use the softness to extend validity or add banded clauses.
-
For urgent drops, consider sea→air via efficient hubs to trim 7–12 days without full air cost.
Global comparison & market read
| Region | Ocean — typical ranges (USD) | Air — typical ranges (USD/kg) | Signal of the month |
|---|---|---|---|
| USA West | 1600–2300 | 4.5 | Post-frontloading softness |
| USA East | 2100–2750 | 5.5–5.6 | Easing congestion |
| Canada | 3500–4300 | 5.5–5.8 | Mild ocean dip |
| Mexico | 3750–4600 | 7 | Strong ocean surge |
| Mediterranean | 1460–3300 | 3.5–4.5 | Stable to slight dip |
| Europe (hubs) | 1400 / 2350 (20’/40’) | 4.0–4.2+ | Ocean down, selective air up |
| Europe (CH/PL) | 1600–2800 | ~4 | Steep ocean declines |
| Africa (W/C/S) | 3075–5700 | 5.5–8 | Ocean down, air elevated |
| APAC – Oceania | 1500 / 2900 | 3.8–4 | Ocean up (AU/NZ) |
| APAC – ASEAN | 100–755 / 125–1200 | 1.5–2.3 | Mixed |
| APAC – South Asia | 1350–1950 | 4.5–5.5 | India ocean up |
| APAC – Japan | 300 / 450 | 1.5 | Stable |
| Latin America | 3500–8000+ | 7–11 | Mixed; strong rises CO/EC/CL |
Shipment optimization tips
-
Timing & negotiation
-
USA/Canada/Europe: lock low rates now (spot + short, indexed).
-
Mexico & hot LATAM lanes: book space 3–4 weeks ahead.
-
Mode mix
-
Keep air for urgent/high-margin SKUs; consider sea-air/Asia transshipment if lead time allows.
-
Total landed cost
-
Simulate duties + freight; test alternate ports, FTZs, and suspensive regimes.
-
Capacity & clauses
-
Blend spot + short FAK; add banded rates for Q4 and air allocations for peak pockets.
-
Boxing economics
-
Weigh 40HQ vs 2×20GP (€/m³, vessel space, THC, handling).
Risks, compliance & operations
| Risk | Impact | SINO measures |
|---|---|---|
| China export checks (Reg. 150) | Delay/cost ↑ (lamps, low-voltage, “functional” apparel) | HS verification, pre-inspection, ETD buffers |
| West Africa inspections | Clearance variability | Pre-clearance, strict docs, local partners |
| Red Sea & blank sailings | Longer transits | Alternate ports, buffers, proactive tracking |
| Reciprocal tariffs | Landed cost uncertainty | “Duty+freight” sims, FTZ options |
Methodology & FAQ
Methodology. China origin → listed destinations; containers 20GP/40GP/40HQ; air A2A general cargo; levels are bookable ranges subject to ETD, density/volumetrics, surcharges (BAF/CAF/PSS), carrier & space.
What are the headline changes this month across all regions?
Ocean rates generally fell into the USA, Canada and much of Europe, surged into Mexico, stayed broadly stable in the Mediterranean, declined across parts of Africa, and rose in Oceania and parts of South Asia. Air pricing was largely stable worldwide with localized upticks at hubs such as London Heathrow and Hamburg in Europe and in select Latin American markets. The backdrop combines vessel oversupply, lingering Red Sea rerouting effects, and tariff-related demand shifts.
Why are US and Canada ocean rates down while Mexico is up?
US and Canadian lanes are easing after pre-tariff frontloading and improved schedule reliability, which increases available capacity and softens spot levels. Mexico’s Pacific gateways face firmer demand and tighter equipment, so 20GP and 40HQ quotes escalated sharply despite air remaining flat.
What explains the sharp ocean declines in Europe’s main ports while some air hubs are pricier?
A wave of capacity and network adjustments kept FAK pressure downward at North European gateways, while time-sensitive demand and e-commerce funneled into air at select hubs, lifting average posted rates at Heathrow and Hamburg. In the Mediterranean, supply-demand conditions were more balanced, leaving Italy and Turkey flat and Spain slightly cheaper on 40GP.
How do African lanes look in September?
West, Central and Southern Africa show lower ocean rates on ample space, East Africa is mixed with Kenya flat and inland corridors like Uganda and Rwanda shaped by feeder and road or rail legs, and North Africa is stable. Air is steady but remains elevated where cold-chain and e-commerce flows absorb capacity, and tighter customs scrutiny in some West African markets argues for extra documentation discipline and timeline buffers.
What are the big takeaways in APAC destination lanes (Oceania, ASEAN, South Asia, Japan)?
Australia and New Zealand saw meaningful ocean increases, ASEAN is largely stable to slightly higher with pockets of softness in Indonesia, India trended up on ocean rates with air steady, and Japan stayed predictable on both modes. Singapore remains a dependable sea-to-air pivot when speed is needed without full end-to-end air spend.
How do current tariffs and trade frictions affect what shippers pay?
Reciprocal tariffs implemented earlier in 2025 continue to reshape ordering patterns, creating short bursts of frontloading into certain gateways, while retaliatory measures in multiple regions influence lane selection and total landed cost. The effect for a given shipment depends on HS codes, origin–destination pairing, and whether an alternate gateway or FTZ structure can offset duty plus freight.
Should I pick a 40HQ or ship two 20GPs?
A single 40HQ usually beats two 20GPs on total ocean cost this month on most lanes, provided weight and cube allow. The practical rule is to compare one 40HQ including local handling against the sum of two 20GPs plus any extra THC and manipulation fees; the examples in each regional section show sizable savings in Europe, Africa and Latin America and smaller but still positive advantages in Oceania and parts of South Asia.
When should I book space by region to balance price and service?
Typical booking lead-time guidance for this month is summarized below. Values describe how far in advance to place FCL bookings to secure equipment and preferred loops.